Observing Nature in the Real World
by Lewis Loflin
Follow @Lewis90068157
Note this writer takes this issue from a historical perspective with strict adherence to the scientific method. If a claim can't be proven or tested in the material world then it is not science.
It was cooler in the 1970s when I was growing up in the southern Appalachians. It is warmer today (2023) at least here, but is that natural variation or caused by humans? This has happened all through history according to historical and proxy data. That makes the question impossible to answer for certain.
My wife and I have noted over the past decade that brush and wild plants grow like crazy. I struggle to keep this cut back. The property behind my house was logged about 30 years ago. The damage looked terrible at the time. I kept one of the logging roads cleared and can now walk under a canopy of trees.
Human influence is still obvious, but is no consequence. That forest abounds with wildlife more than even 50 years ago, including bears. I normally carry a handgun for that reason. There are a number of invasive plants, the forest doesn't seem to care nor do I, but others for irrational reasons are obsessed that nature should be static, that any human influence be treated as evil.
What is missing are the massive chestnut trees. My house built in the 1880s is full of chestnut lumber, but I have never seen a chestnut tree. They died out in the 1920s due to a blight or fungus introduced from Asia.
We could have millions of chestnut trees regrowing years ago, nothing today. Scientists added a gene from wheat to chestnut trees to counteract the blight. The science of genetic engineering is treated as heresy. Activists demand a "natural" unaltered nature. Let's replant the damned chestnut trees.
Science is only good when it supports certain political and social positions. There is no argument "nature" is better off in America today than 100 years ago. Animals flourish and many forests have regrown. We raise more food than ever on less land.
Where I grew up in the Virginia coalfields the air was hazy from due to smoke from coke ovens and wood-coal stoves. The air is now cleaner and getting more so. I detested the damage done by strip mining as I grew up, but that energy enabled the creation of an industrial-technological society that can clean up the damage and replace nasty coal with new energy sources such as nuclear.
Wind and solar are not renewable because the materials and energy that go into manufacturing them are resource intensive and creates massive pollution problems. The mining damage is worse than coal mining.
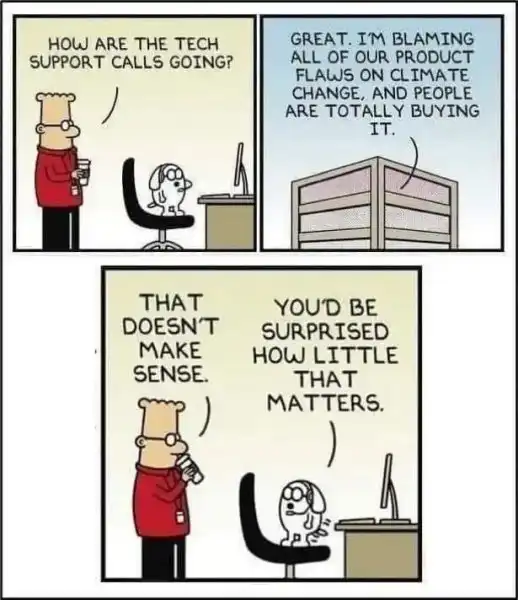
Never let reason or reality get in the way of feelings. The answer is direct observation and draw conclusions based on those observations.
Droughts are not caused by modern "climate change." To quote:
Between the mid and late nineteenth century three severe droughts struck North America and each had its own effect on the social, ecological and environmental state of the Plains and the West. The drought of the mid-1850s to the mid 1860s, or Civil War drought, added to the complex mix of factors leading to the near extinction of the American bison. The 1870s drought aided in creating the conditions for horrific locust swarms that devastated the West. The 1890s drought took a serious toll on settlers trying to practice dry farming on the high plains, led to a reopening of the frontier through depopulation, and to the 1902 Reclamation Act and the increasing involvement of the federal government in the settling of the West.
Further:
Hemispheric symmetry of the Nineteenth Century droughts The model simulations suggest that the North American droughts of the Nineteenth Century were part of a larger global pattern in which drought struck across the mid-latitudes of each hemisphere. For this period the instrumental data is sparse outside of Europe...
Ref. Causes and consequences of nineteenth century droughts in North America by Richard Seager and Celine Herweijer Lamont-Doherty Earth Observatory of Columbia University.
This is the proper use of computer modeling. This was based on what was observed including historical records. Where they lacked data such as outside America and Europe they admitted it. What they didn't do was manufacture data they didn't have.
In 1861-62 California suffered from flooding so bad it nearly made the state uninhabitable. This caused $1 trillion in damage. It was the largest in history of California, Oregon, Nevada, parts of British Columbia and Mexico. Ref. Yale Climate Connections. Recent flooding in California is a joke, 1938 was far worse.
Their hypothesis of "global" impact is born out by actual evidence.
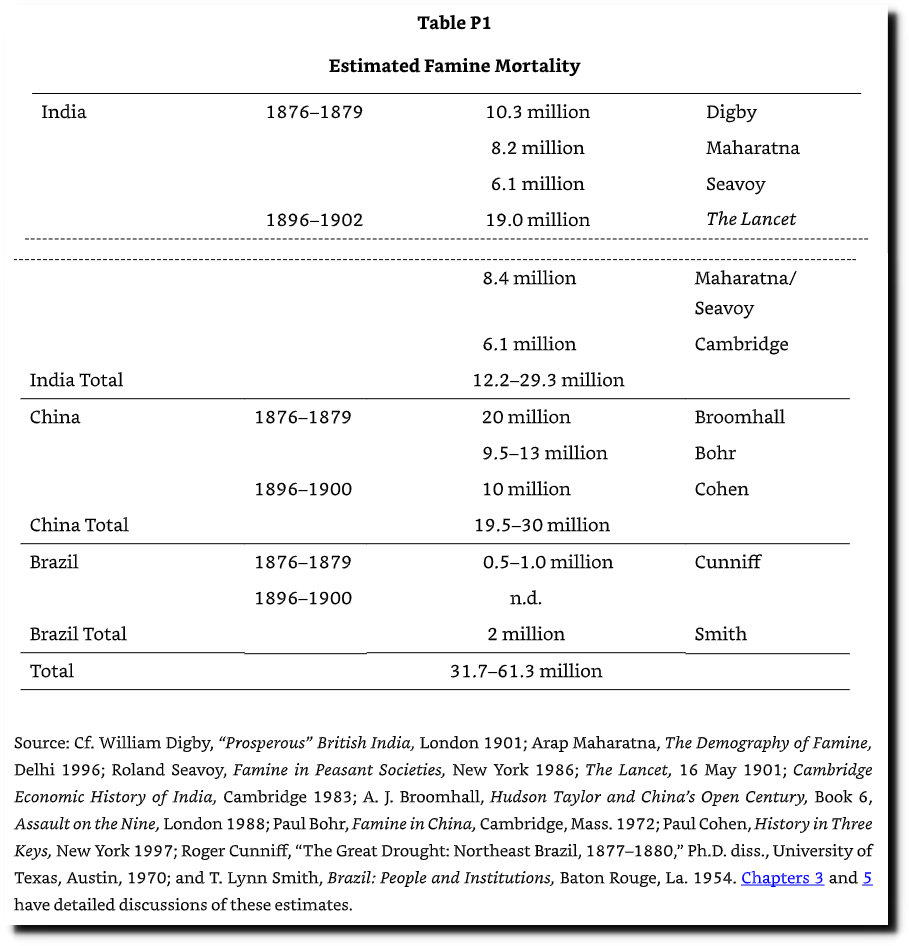
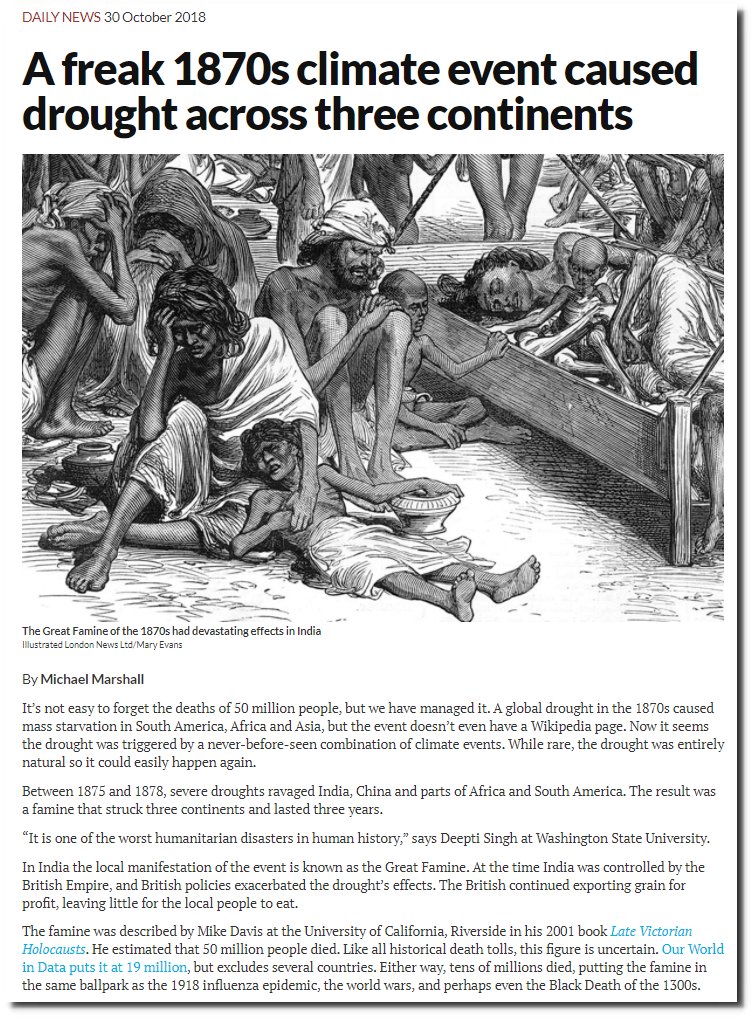
The Dailey News October 30, 2018 published an article "A freak climate event caused drought across three continents." Between 1875-1878 "drought ravaged India, China, parts of Africa and South America."
The 1890s drought that ravaged America also ravaged India, killing as many as 19 million. Total India alone 12.2-19.3 million. China death toll 1870s and 1890s 19.5-30 million, Brazil another 2 million.
Total 31.7-61.3 million in 30 years in just three countries. Ref. Estimated Famine Mortality. This is a graphic.
Also see india_famine.jpg.
Testing tree rings and correlating data on a computer is fine. Measure the number of stomata in fossil plants (they vary by CO2 levels) is proper physical data. Ice cores, the chemical composition of rocks and fossils, isotope ratios, and the distribution of fossil plants and animals are examples of appropriate data sources. So are historical records.
Stomata in plants are where air enters the plant through transpiration (evaporation of water) to extract CO2. The more CO2 (we do this in greenhouses), the faster the plant grows and uses less water. The lower number of stomata, the higher the CO2 levels. This data can be measured and tested. Stromata indicates CO2 was not a fixed 280 PPM level before 1800 but varied widely. To quote,
"The average of CO2 concentrations across the Holocene interglacial period (last 11,000 years) appears to have been approximately 305 ppm. Contrary to the prevailing notion of CO2 stability, CO2 swings of 20-50 ppm or more over timespans of 500-1000 years appear to be the norm - not the exception."
NASA notes the earth has "greened," and their map shows this to be most significant in dry areas. Again, higher CO2 levels, more plants, and less water are required. But under dry conditions, be it natural or artificial, more wildfires. Wildfires are a normal part of nature. Proactive forest management is vital regardless of opposition from environmental activists.
Again this is an example of direct, verifiable observation.
When data is lacking, it is proper to say so. Manufacturing data is scientific fraud. Temperature measurements before 1950 mostly covered North America, Europe, and Australia. Data from the rest of the world, particularly the southern hemisphere, is sparse.
Another tactic is picking arbitrary dates. Often, "pre-industrial" is touted in the press. That is 1750, during the Little Ice Age, when the Thames froze over. This date is absurd. It has warmed since then, but how could humans be responsible?
Then, they went to 1880 and had no global data until the late 1960s. Their temperature data before the 1970s from North America and Europe was computer-modeled down and passed off as global temperatures. Modern sea buoys to measure temperatures appeared in the 1950s.
Then they reference 1979, the bottom of a cooling trough from the early 1950s. Since then, they have used satellite data.
This date and data fiddling constitutes a dishonest tactic to sway public opinion. Again, there is no "global" data as defined today before the 1960s—their claims of "record" this and that are public relations ploys.
We have satellite data going back to the 1960s. Why 1979? The following extracts from Time Magazine June 24, 1974 is part of what they are refuse to address.
"In Africa, drought continues for the sixth consecutive year, adding terribly to the toll of famine victims. During 1972 record rains in parts of the U.S., Pakistan and Japan caused some of the worst flooding in centuries. In Canada's wheat belt, a particularly chilly and rainy spring has delayed planting and may well bring a disappointingly small harvest. ...the bizarre and unpredictable weather pattern of the past several years, a growing number of scientists are beginning to suspect that many seemingly contradictory meteorological fluctuations are actually part of a global climatic upheaval. However widely the weather varies from place to place and time to time, when meteorologists take an average of temperatures around the globe they find that the atmosphere has been growing gradually cooler for the past three decades..."
"Telltale signs are everywhere —from the unexpected persistence and thickness of pack ice in the waters around Iceland to the southward migration of a warmth-loving creature like the armadillo from the Midwest. Since the 1940s the mean global temperature* has dropped about 2.7 Deg. F. Although that figure is at best an estimate, it is supported by other convincing data. When Climatologist George J. Kukla of Columbia University's Lamont-Doherty Geological Observatory and his wife Helena analyzed satellite weather data for the Northern Hemisphere, they found that the area of the ice and snow cover had suddenly increased by 12% in 1971 and the increase has persisted ever since. Areas of Baffin Island in the Canadian Arctic, for example, were once totally free of any snow in summer; now they are covered year round."
* Other sources claim 0.5-1.0 Deg. F. drop.
That fits exactly what I observed as a kid including living though two bad destructive floods (1969 in Richmond, other in Southwest Virginia). Even in August camping out at night was cold.
Since it warmed back up the levels of the 1920s-1940s this reversed. The cold and climate swings are credited not only for severe drought in Africa in the 1970s.
"By blocking moisture-bearing equatorial winds and preventing them from bringing rainfall to the parched sub-Sahara region, as well as other drought-ridden areas stretching all the way from Central America to the Middle East and India, the polar winds have in effect caused the Sahara and other deserts to reach farther to the south. .. The collision of air masses of widely differing temperatures and humidity can create violent storms—the Midwest's recent rash of disastrous tornadoes, for example."
That refers to the April 3, 1974 Super Outbreak according to the National Weather Service:
"April 3-4, 1974 tornado outbreak - one of the worst tornado outbreaks to ever affect the U.S. Dubbed the "Super Outbreak", at least 148 tornadoes struck 13 states from the Gulf Coast to the Great Lakes over a 16 hour period from the afternoon of April 3, 1974 into the early morning hours of April 4, 1974. When it was over, 330 people were dead and 5,484 were injured. Damage from all of the tornadoes combined added up to a path more than 2,500 miles long.
Across Middle Tennessee, at least 24 tornadoes affected areas along and east of the I-65 corridor, making this the largest known outbreak of tornadoes to ever impact the Mid State. In fact, several other weak tornadoes also likely touched down that were never officially recorded. The "Super Outbreak" is considered the worst tornado outbreak to strike the Upper Cumberland Region, with 38 people killed and hundreds of others injured."
The Joplin Tornado of 2011 killed 158 people.
What else happened besides the failed Russian wheat harvest? Or the two massive floods hitting Richmond, Virignia from Hurricane Camille (1969) and Agnes (1972)?
The press falling back to 1979 hides the earlier and severe climate shifts of the pre-1979 20th century. Note the following news report
."The Braidwood Dispatch and Mining Journal" (NSW : 1888 - 1954) 28 Sep 1910 Page 4 has the following eyewitness report on melting glaciers:
"Except over a small area, it is generally understood, the glaciers of the world are retreating to the mountains. The glacier on Mount Sermiento in South America, which descended to the sea when Darwin found it in 1836, is now separated from the shore by a vigorous growth of timber. The Jacobshaven glacier in Greenland has retreated four miles since 1850, and the East glacier in Spitzbergen is more than a mile away from its original terminal moraine. In Scandinavia the snowline is further up the mountains, and the glaciers have withdrawn 3,000ft. from the lowlands in a century. The Araphoe glacier in the Rocky Mountains, with characteristic American enterprise, has been melting at a rapid rate for several years. In the Eastern Alps and one or two other small districts the glaciers are growing. In view of these facts we should not be too sceptical when old men assure us that winters nowadays are not to be compared with the winters of their boyhood."
These events occurred in 1910, and there was no possible way CO2 had anything to do with this. That is data. Glaciers can grow and retreat rapidly in 1910 and today. I'm sick of hearing about Arctic sea ice gone any day. According to satellite data, there is more sea ice in July 2023 than in September 1980.
One headline is as follows for 2023, "Global average sea surface temperatures last month reached unprecedented levels for June. The north Atlantic Ocean recorded exceptionally warm sea surface temperatures, with several extreme marine heatwaves."
My gosh the tuna are boiling! Put this in perspective. The "global" record goes to 1979. The number is run up by El Nino that normally has very hot cycles. This runs along the western coast of South America a very arid region, but has a massive anchovy fishing industry - at times depending on El Nino and La Nina. To quote from the 1920s,
"In 1925 the weather went crazy. In January fisherfolk at Talara in extreme northern Peru reported unusually warm sea temperatures. The ocean temperature rose by 6.6 degrees Celsius in ten days and kept rising. The warming waters moved southward. By March the Pacific temperature off the Moche River (northern coast of Peru)had risen to twenty-eight degrees Celsius, sixteen degrees above normal, before settling down to a steady twenty-two degrees over more than eleven hundred kilometers of the Peruvian coastline. Some cooling began in April, but warmer than usual temperatures would persist right through 1930. As sea temperatures rose, the easterly trade winds faltered, then reversed. At least twenty-four million cormorants and other seabirds died of starvation as the anchovies moved away into cooler, nutrient-rich waters. Seabird corpses littered beaches and offshore islands. So much sea life perished and decomposed on the ocean floor that foul-smelling hydrogen sulfide that reacted with the white lead paint on ships’ hulls blackened them and discolored houses by the water's edge."
This is what nature normally does. Ref. "Floods, Famines, and Emperors El Nino and the Fate of Civilizations" 1999 by Brian Fagan Page 32.
In addition, there is the issue of Saharan dust over the North Atlantic. It can reach Florida, affecting hurricanes, ocean surface temperatures, rainfall, and droughts.
As of June 2023, "the low dust concentrations so far could be compounding the pronounced warming trend across the Atlantic...the tropical north Atlantic is experiencing a heat wave like few others we've seen in decades, complicating seasonal hurricane forecasts in 2023."
Note "as seen in decades" means this is nothing new.
Saharan dust cools the oceans by reflecting and scattering sunlight. This dust and El Nino doesn't prove all the warming is natural but can play a significant part. We don't know because we don't have enough data over a long enough period.
Again, I stress caution with these kinds of reports. A 2-degree Fahrenheit temperature rise from a 2.7-degree Fahrenheit drop in the early 1970s does not concern me. This fear of an alleged 2-degree Fahrenheit temperature rise since 1750 does not interest me. This change is a normal variation with possible human influence.
Like Biblical prophecy, speculative computer models require faith in "prophets" driven by politics and spiritual views, with magical machines running esoteric programming. "Faith in science" is religion. Decades of failed predictions suggest it is time for a reformation or caution. Sever science from public policy. The following is from Drought.gov.
Historical Drought: The 1930s "Dust Bowl" drought remains the most significant drought—meteorological and agricultural-in the United States' historical record. Drought is a normal climate pattern that has occurred in varying degrees of length, severity, and size throughout history. Tree ring archives indicate that agricultural droughts such as those that happened in the United States during the 1930s Dust Bowl era have occurred occasionally over the last 2,000 years, and climate model simulations suggest that droughts that may last several years to even decades occur naturally in the southwestern U.S.
The rest continues with the usual future "climate change" dogma projections and subjective computer models. No, just the known facts, please.
Computer models are fine for past events, assuming one has enough measured data. But past climate data is proxy data, often low-resolution, such as ice cores. Even much-touted radio-carbon dating can be off by decades or a century. This problem is because C14 results from cosmic rays that, like solar radiation, are variable and can't be predicted.
Precision has become an issue when dealing with small fractional numbers spread over past decades and centuries. Proxy data can reveal a prolonged drought but not daily rainfall or temperatures. If available, one must rely on local historical records in literate parts of the world.
Summary: Droughts, floods, and other "climate" events are a normal part of nature and the earth's dynamic geology. We have vast historical records and proxy data: The world wasn't created in 1979 that climate activists fall back to.
- Observing Nature in the Real World
- Venus was Never Like Earth Science is Never Settled
- Mastodons Roamed Greenland 2 Million Years Ago
- Present Global Warming Began Circa 1800
- Dissecting Critical Climate Theory
- $1.5 Trillion Climate Change Industrial Complex
- Climate Change Cover for Spiritual & Social Revolution
- Corporate Welfare Grifters Climate Non-Crisis
- When Mythology Replaces Science
- Facts on Hurricanes and Tornadoes Past Present
- Why we should not fear nuclear power.
- Nuclear Graveyards Abound with Life
- What About Humans and Nuclear Radiation?
- Radiation Basics They Should Teach in High School
- How Woke Racism is Killing Education
- What PISA Scores Reveal About Immigration
- Deranged California Teacher Obsesses Over Race
- Lack of Ability is Not Systemic Racism
- Chicago Schools Ruined by Racial Diversity
- High scoring low-income students are white and Asian
- Michigan Muslim-Black Problem in Education
- Electronics, Nuclear Reactors, Applied Science
- Electronics and Technology Built at Home


- Off Site:
- Web Master
- Tri-Cities VA-TN
- General Science
- Hobby Electronics
- US Constitution
- Christianity 101
- Religious Themes
Web site Copyright Lewis Loflin, All rights reserved.
If using this material on another site, please provide a link back to my site.