Fig. 1
What PISA Scores Reveal About Immigration
by Lewis Loflin
Follow @Lewis90068157
What is PISA? "PISA is the OECD's Program for International Student Assessment. PISA measures 15-year-olds’ ability to use their reading, mathematics and science knowledge and skills to meet real-life challenges."
For those that chose to participate in PISA, this indicates the intellectual level of a nation's citizens. This series of tests is related to scientific and technical advancement, stable politics, etc. These scores are also critical when it comes to immigration. The intellectual and social deficiencies in nations of origin get reproduced here.
PISA is a direct indicator of intellectual ability on a national scale.
This doesn't refer to "brain draining" third-world nations of the few successful people, but the masses themselves. Those test scores scared the hell out of me but were no surprise considering immigrant outcomes in America.
South Africa and India were so dismal they refused to participate. No African, Latin American, or Muslim nation scored in the top half. Even Israel, an "intellectual giant," did little better than Muslim Turkey.
Diversity is killing US education. Texas school systems are now 26.5% white, 53% Hispanic, black 12.7%, Asian 4.7% in 2021. Texas state-wide reading failure rate is 58%. Their state-wide math failure rate is 63%. If one is not proficient, then they are failing. A 50% drop from 2010-2021. After the Covid fiasco and more illegal aliens, things are certainly worse.
These reports make no sense. ~61% are "economically disadvantaged" (meaning failing minority), ~22% can't speak English, ~12% mentally retarded, slow, or other problems (special education).
What do they call special education now? "Individualized Education Program (IEP)" Yet they claim a 90% graduation rate?
US whites out-scored all other white nations except Estonia and out-scored Japan and Korea in 2018. US Hispanics scored poorly but better than any other Latin American nation. US whites in science scored 40 points above the global OECD average, and American blacks scored 49 points below for an intellectual gap of 89 points.
| Education system | Mean | Reading | Math | Science |
| U.S. Asians | 549 | 556 | 539 | 551 |
| Estonia | 525 | 523 | 523 | 530 |
| U.S. Whites | 521 | 531 | 503 | 529 |
| United States | 495 | 505 | 478 | 502 |
| U.S. multiracial | 492 | 501 | 474 | 502 |
| OECD average | 488 | 487 | 489 | 489 |
| U.S. Hispanics | 470 | 481 | 452 | 478 |
| U.S. blacks | 436 | 448 | 419 | 440 |
| Education system | Mean | Reading | Math | Science |
| B-S-J-Z (China) | 579 | 555 | 591 | 590 |
| Singapore | 556 | 549 | 569 | 551 |
| U.S. Asians | 549 | 556 | 539 | 551 |
| Macau (China) | 542 | 525 | 558 | 544 |
| Hong Kong | 531 | 524 | 551 | 517 |
| U.S. Whites | 521 | 531 | 503 | 529 |
| Japan | 520 | 504 | 527 | 529 |
| South Korea | 520 | 514 | 526 | 519 |
| Taiwan | 517 | 503 | 531 | 516 |
| United States | 495 | 505 | 478 | 502 |
| OECD average | 488 | 487 | 489 | 489 |
| U.S. Hispanics | 470 | 481 | 452 | 478 |
| Israel | 465 | 470 | 463 | 462 |
| Turkey¹ | 463 | 466 | 454 | 468 |
| U.S. blacks | 436 | 448 | 419 | 440 |
| Malaysia¹ | 431 | 415 | 440 | 438 |
| Thailand¹ | 413 | 393 | 419 | 426 |
| Indonesia | 382 | 371 | 379 | 396 |
| Philippines¹ | 350 | 340 | 353 | 357 |
Note that I changed "Chinese Taipei" to Taiwan. While China is on top, they only test in their most prosperous cities, not the entire country. Vast tracks of rural China are poor and backward.
Singapore is an interesting case of contrasts. "Republic of Singapore is an island country and city-state." It became an independent country in 1965 from Malaysia. It is ~75% ethnic Chinese. It scores nearly at the top in intellectual ability and thus is prosperous. In science, they score 551 or 61 points above the OECD average.
But Malaysia scores a pathetic 438 in science below low-achieving US blacks or 51 points below the OECD average. They still score better than Thailand (426), Indonesia (396), and the Philippines (357).
In Europe, Scandinavian whites far outscore whites from the Balkans in the way East Asians outscore all other Asians.
| Education system | Mean | Reading | Math | Science |
| OECD average | 488 | 487 | 489 | 489 |
| U.S. Hispanics | 470 | 481 | 452 | 478 |
| Chile | 438 | 452 | 417 | 444 |
| U.S. blacks | 436 | 448 | 419 | 440 |
| Uruguay | 424 | 427 | 418 | 426 |
| Mexico¹ | 416 | 420 | 409 | 419 |
| Costa Rica¹ | 415 | 426 | 402 | 416 |
| Colombia¹ | 405 | 412 | 391 | 413 |
| Peru¹ | 402 | 401 | 400 | 404 |
| Brazil¹ | 400 | 413 | 384 | 404 |
| Argentina | 395 | 402 | 379 | 404 |
| Dominican Rep. | 334 | 342 | 325 | 336 |
Hispanics are a particular and growing problem. According to PEW, 82% of "immigrants" in 2015 were non-white, and likely many whites are low-achieving Muslims. In Flint, Michigan, Muslims (counted as white) score as poorly as blacks. Hispanics made up 48% of the total in 2015.
Except for Chile, Latin American intellectual failure rates fall far below low-achieving American blacks.
Their children do poorly in schools forcing taxpayers to waste disproportionate resources while lowering standards to avoid accusations of racism.
This can be seen in all school systems in states with a high Hispanic population. In Texas alone, reading and math proficiency has fallen 50% from 2010-2021.
In Chicago with a student body 46.7% Hispanic/Latino 75% are failing math and reading. And this is multi-generational problem.
See the graphic 67% Hispanic immigrants in the US over 15 years are functional illiterate.
Mass immigration from low-achieving OECD nations has driven American education into the gutter. We don't get enough East Asian immigrants to compensate for the millions of low achievers. Even many of the immigrants from China are poor, rural peasants.
Let's throw in as many as 6 million plus illegal aliens over the last two years. The numbers will get worse.
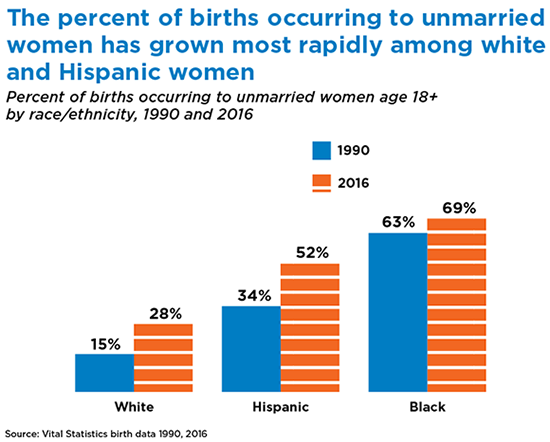
Another problem with Hispanics is the staggering levels of single mothers, even in Latin America. In the US, Hispanics are eclipsing blacks for single-mother homes and the social ills and high welfare costs this causes. Their unmarried family failure rate is over 52%. For whites the failure rate is ~27%.
This is not a direct question of race. Argentina is mostly white but suffers constant political instability and low PISA scores ranking near the bottom.
To quote a study from Bear-Stearns in 2005 how illegal aliens distort the entire economy as many costs are hidden or shifted elsewhere:
States with high populations of undocumented immigrants have experienced extra demand for public services. The top nine states, California, Texas, Florida, New York, Illinois , New Jersey, Arizona, Georgia and North Carolina account for approximately 50% of the undocumented population. Although the federal government has the sole authority to govern immigration flows, the responsibility for providing support to legal and illegal immigrants rests with the state and local governments
This is why Blue States and cities that support illegal aliens want them to go elsewhere.
The number of illegal immigrants in the United States may be as high as 20 million people, more than double the official 9 million people estimated by the Census Bureau...The social expenses of health care, retirement funding, education and law enforcement are potentially accruing at $30 billion per year...the United States may be foregoing $35 billion a year in income tax collections because of the number of jobs that are now off the books...
The United States is simply hooked on cheap, illegal workers and deferring the costs of providing public services to these quasi-Americans. Illegal immigration has been America’s way of competing with the low-wage forces of Asia and Latin America, and deserves more credit for the steroid-enhanced effect it has had on productivity, low inflation, housing starts, and retail sales.
The reality is millions are left in poverty both native born and illegal alien. Blacks in particular have been displaced out of entire industries such as meat packing.
The illegal alien population as of 2023 with the Biden surge easily exceeds 30 million.

- Observing Nature in the Real World
- Venus was Never Like Earth Science is Never Settled
- Mastodons Roamed Greenland 2 Million Years Ago
- Present Global Warming Began Circa 1800
- Dissecting Critical Climate Theory
- $1.5 Trillion Climate Change Industrial Complex
- Climate Change Cover for Spiritual & Social Revolution
- Corporate Welfare Grifters Climate Non-Crisis
- When Mythology Replaces Science
- Facts on Hurricanes and Tornadoes Past Present
- Why we should not fear nuclear power.
- Nuclear Graveyards Abound with Life
- What About Humans and Nuclear Radiation?
- Radiation Basics They Should Teach in High School
- How Woke Racism is Killing Education
- What PISA Scores Reveal About Immigration
- Deranged California Teacher Obsesses Over Race
- Lack of Ability is Not Systemic Racism
- Chicago Schools Ruined by Racial Diversity
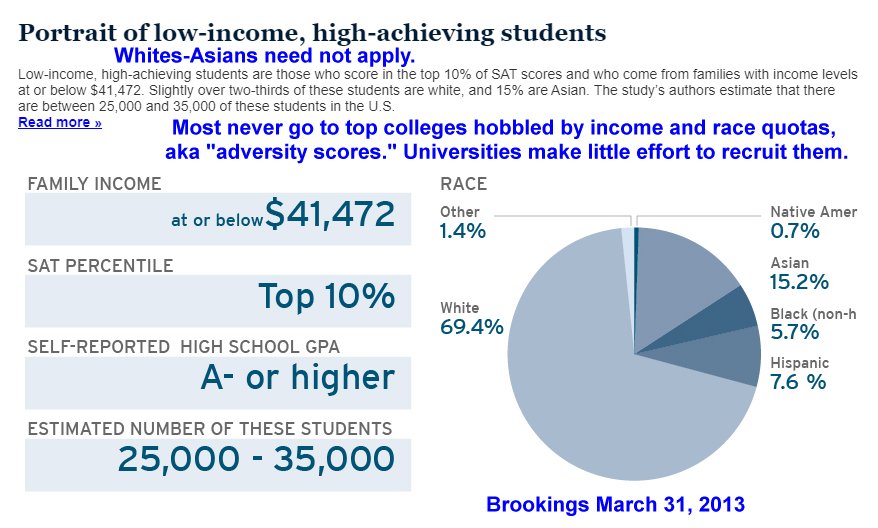
- High scoring low-income students are white and Asian
- Michigan Muslim-Black Problem in Education
- Electronics, Nuclear Reactors, Applied Science
- Electronics and Technology Built at Home
Bristolblog.com is my other website. I'm a conservationist, I consider ecology a pseudo-religion. Some of the subjects covered:
- Why Learning Programming is Difficult
- Institutionalized Liberal Failure
- What Level of Knowledge for Technology?
- Defining Science and Reason
- Eco-Spiritually is Anti-Science
- Why Do EPA Scientists Oppose Public Disclosure?
- Why Public Disclosure is a Right
- 84% of Americans Fear the Government for Good Reason
- Mechanism Not Spiritualism the Basis of Science
- Eocene Epoch Versus Modern Climate Hysteria
- Education Ruined by Diversity Racism
- Michigan Education Ruined by Diversity
- Baltimore Schools Another Diversity Failure
- Michigan Proves Merit Based Immigration Needed for Muslims
- California Merit Based Immigration Needed for Hispanics
- Black Boys Can't Read in California
- Debunking Liberal Race Mythology
- Slaves Never Built America - Slavery Ruined the South
- Inconvenient Truth Black Slavery, Lynchings in the U.S.
- Majority of Poor Americans are White

- Off Site:
- Web Master
- Tri-Cities VA-TN
- General Science
- Hobby Electronics
- US Constitution
- Christianity 101
- Religious Themes
Web site Copyright Lewis Loflin, All rights reserved.
If using this material on another site, please provide a link back to my site.